
Previously on MoreLiver’s:
Let's take a look at few charts. You might want to open these in another window for a closer look. European core countries' bond yields (ten-year government bonds) were tickling recent ranges' top, but the Italian election results and terrible European macronumbers (low PMI, decreased private lending, decreased inflation) turned the trend. The yields of UK and US govvies were practically in an uptrend. Interestingly, Japan's bond yields broke down to new lows, even though the government is pushing for a 2%+ inflation goal through expansionary fiscal and monetary policies. The only major sovereign that has seen their yields rise is Italy. It looks like all of these yields have further downside left.


Next, let's take a closer look at Italy: in August 2012 ECB's Draghi came out with the "whatever it take"-speech, and yields turned down from very nasty, implied euro breakup-levels. With the introduction of the OMT and markets hungry for any return, the yields dropped to lows not seen since October 2010. The downtrend is clearly broken, and it looks like we've had a bottoming-out, and an uptrend is in place.


Next up, the EURUSD. The first weekly chart shows the large range since the onset of the financial crisis. I had previously (October 2012) expected reaching higher levels, around 1.4-1.45 before turning down again. The high of the leg was around 1.37.

Closer look at the EURUSD's downtrend shows nice, clean downtrend, with nice waterfall-like behavior of supports being broken and turning into resistace levels. The trend has intensified, as the previous downtrend channel was not steep enough. Currently at a sell-level.

Even closer look at EURUSD. Currently near a sell-level.

Finally the S&P 500. Longer-term, the SPX is near all-time-highs, simultaneously at pattern highs (is that a wedge or what?). Better short than sorry IMHO. Notice the two major horizontal topping patterns preceding sell-offs.
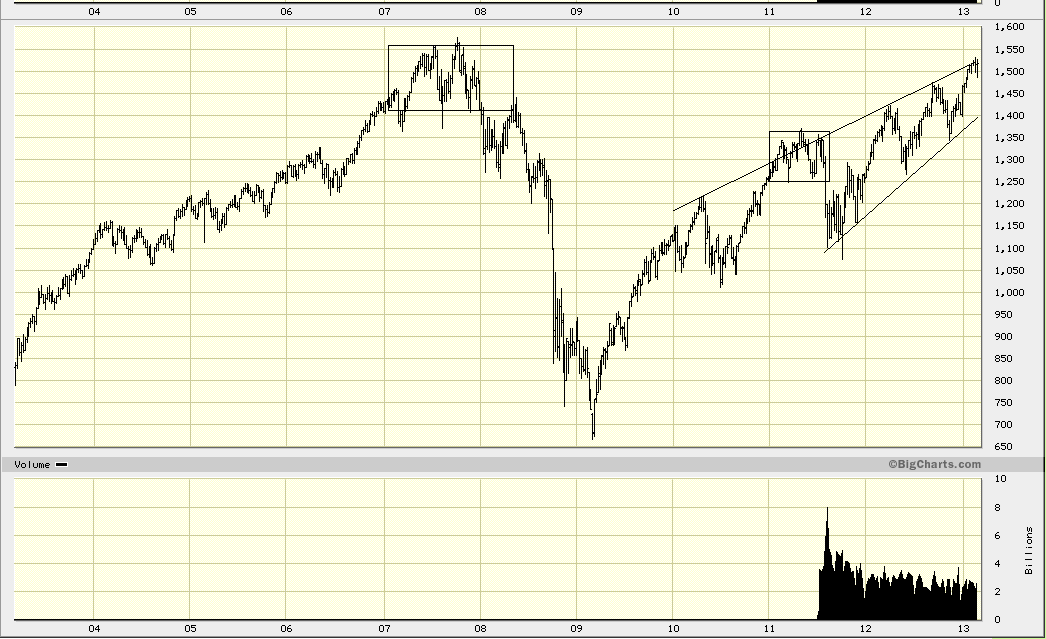
A closer look at SPX. Now we are able to see two more topping patterns during the "wedge". I guess we're in for a horizontal trading range, lasting perhaps couple of weeks. This should be followed by a break lower.
